Own Data. Industry Data. Benchmarking.
Benchmark your performance against national, international, corporate and industry sector standards.
GLOSS — the Global Safety Stats System — delivers handcrafted benchmark charts for fatal and non-fatal injury data across major economies. Understand exactly where your performance stands relative to national, international, and sector-specific standards.
· Australia
· United Kingdom
· United States
· Canada
· Ireland
· Singapore
· New Zealand
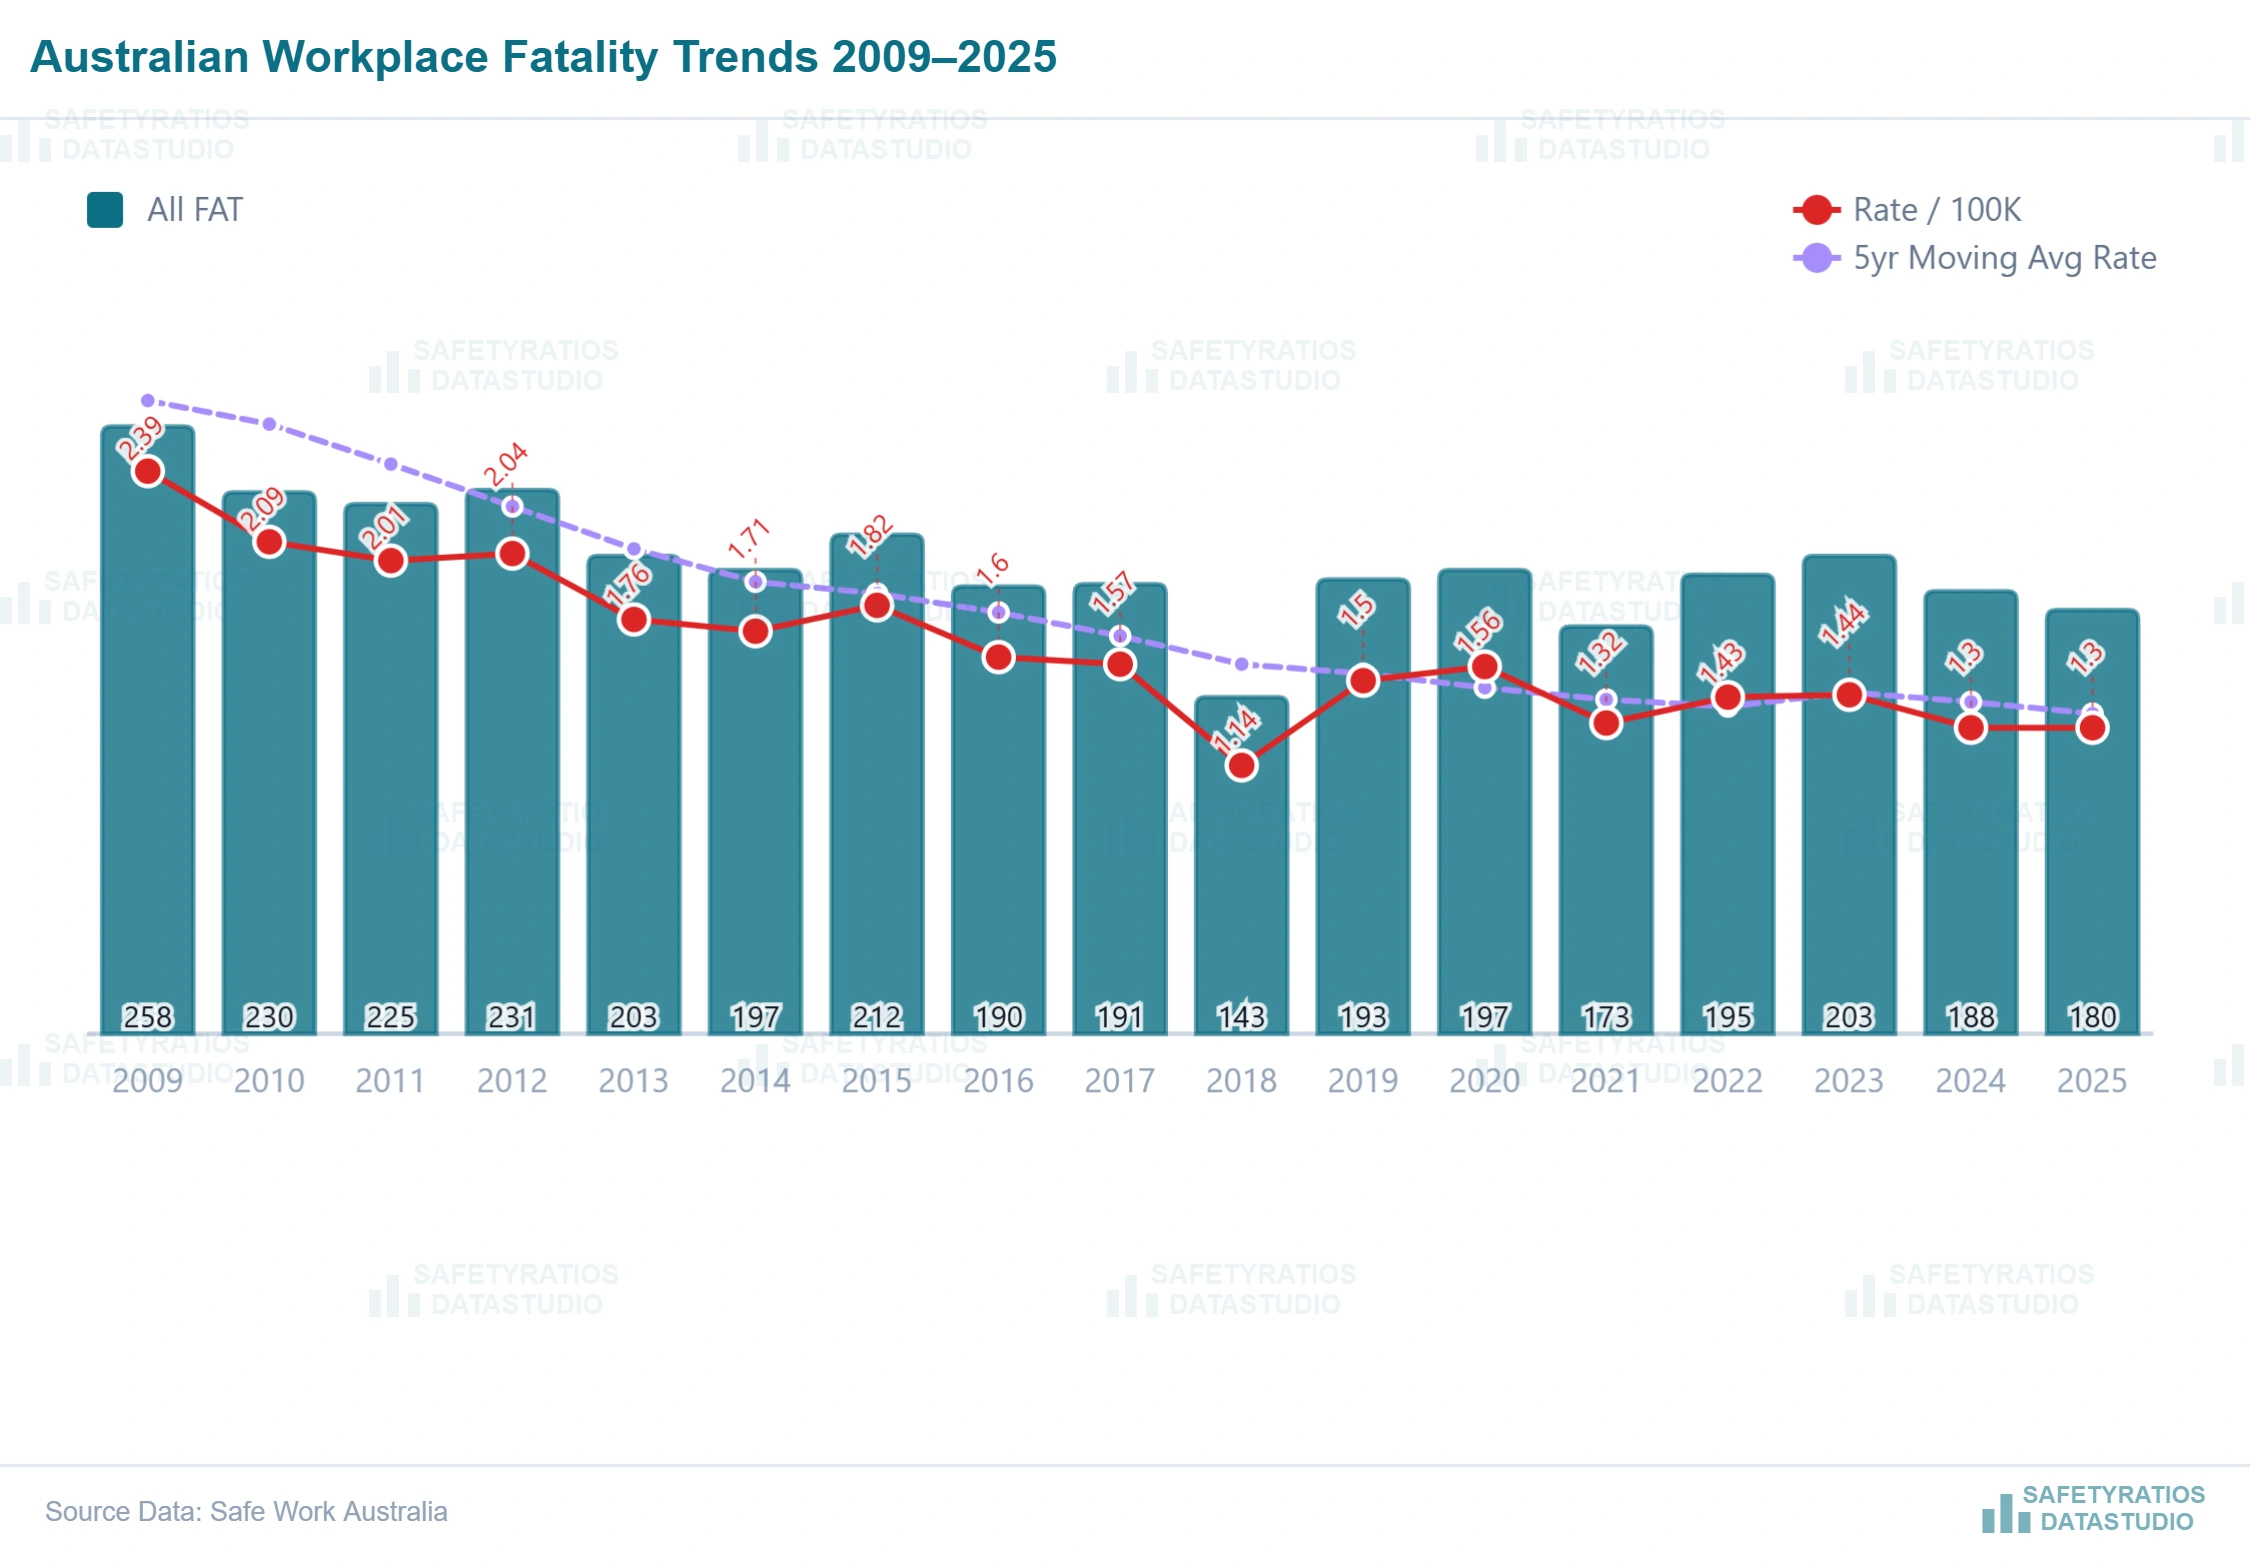
GLOSS · AUS · Fatal Injuries
Australia Workplace Fatality Trends — 2009 to 2025
Safe Work Australia — National Dataset