ISO 45001 Clause 6.1 Planning: The CHART Framework
The Context, Hazards, Assess, Requirements, Translate Model for Turning Risks and Opportunities Into Planned Action
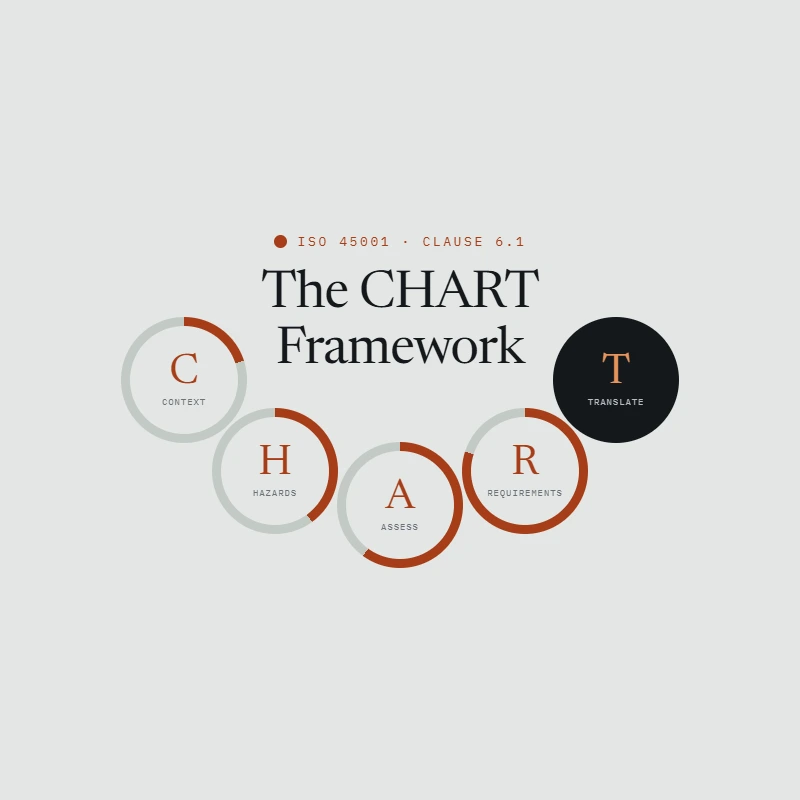
The CHART Framework is a planning model for ISO 45001 Clause 6.1, Actions to address risks and opportunities. Clause 6.1 asks an organisation to turn what it knows about its situation into actions that change what happens on site. It sets out what must be determined but says little about the order, and that omission is where most planning goes wrong. CHART supplies the order: Context, Hazards, Assess, Requirements, Translate. Each step produces something the next one needs, so a gap becomes visible as a gap rather than surfacing later as an action nobody can explain.
Definition and Core Purpose
The CHART Framework treats planning as a course to be plotted rather than a document to be produced. It shifts the question from "have we assessed our risks?" to "at which step did this action lose its connection to the hazard it was meant to control?"
CHART works through five steps, each with its own output:
- Context – read the situation forward, so planning answers what the operation is about to face rather than what it faced last year
- Hazards – surface what is present, including the hazards long familiarity has stopped registering as hazards
- Assess – establish what the risks and opportunities amount to, in terms that support a decision
- Requirements – establish what binds, so the minimum an action must clear and the stretch goals beyond compliance are known before it is chosen
- Translate – convert all of it into action that sits inside the work rather than beside it
The value is in the order, and the order is the clause's own. Context answers 6.1.1, Hazards answers 6.1.2.1, Assess covers 6.1.2.2 and 6.1.2.3 together, Requirements answers 6.1.3, and Translate answers 6.1.4. Planning that begins at Hazards inherits an unexamined picture of the operation. Planning that stops before Translate produces a determination that never becomes a control.
How CHART Maps to Clause 6.1
Each letter corresponds to a specific part of the clause, in the order the clause sets them out. The mapping is what makes the framework auditable rather than merely memorable.
| Step | Clause | What it produces |
|---|---|---|
| Context | 6.1.1, drawing on 4.1, 4.2, 4.3 | A current picture of what the operation is about to face |
| Hazards | 6.1.2.1 | Hazards as they are, including the normalised ones |
| Assess | 6.1.2.2 and 6.1.2.3 | Magnitude of risk, and opportunity rated on the same terms |
| Requirements | 6.1.3 | The minimum requirements any action must clear, and the stretch goals adopted beyond them |
| Translate | 6.1.4 | Action integrated into the work, following the hierarchy of controls |
How CHART Relates to PDCA
CHART sits inside the Plan phase of PDCA and expands it. PDCA treats planning as a single stage; CHART breaks that stage into five, on the basis that most planning failures are failures of sequence rather than of effort. The steps then push outward, since Translate reaches into Do and its evaluation criteria depend on Check.
Inside the Extended Edition
The complete CHART Framework, together with a full worked example, is available free to all subscribers. Eight further sections sit in the extended edition:
- Context: Reading the situation before planning starts, with the signs it is being done well
- Hazards: Seeing what is actually there, including the hazards routine has absorbed
- Assess: Establishing what it all amounts to, risk and opportunity in one movement
- Requirements: Establishing what binds, the minimum requirements and the stretch goals adopted beyond compliance
- Translate: Turning determination into action that sits inside the work
- Where CHART breaks: Five failure signatures, each with the counter built into the process
- Origins and use cases: Where the framework earns its keep, and how it pairs with the Six Arts of the Strategist
- The CHART Framework in Practice: A full worked example, one contract change taken from Context to Translate, then tested with the LDP overlay
Subscribers gain access to the complete documents, while higher-tier members can download them for use in their own training programmes.
Frequently Asked Questions
What does ISO 45001 Clause 6.1 require?
Clause 6.1 requires an organisation to determine the risks and opportunities that must be addressed (6.1.1), identify hazards on an ongoing and proactive basis (6.1.2.1), assess OH&S risks and opportunities (6.1.2.2 and 6.1.2.3), determine the legal and other requirements that apply (6.1.3), and plan actions that are integrated into business processes with their effectiveness evaluated (6.1.4). The CHART Framework works through those requirements in that order.
What is the CHART Framework used for?
CHART works through ISO 45001 Clause 6.1 in the order the clause itself sets: read the context, surface the hazards, assess risk and opportunity, establish what binds, and translate all of it into planned action. It gives planning a sequence, so an organisation can see which step it skipped when an action fails to hold.
Why is it called CHART?
Because planning under Clause 6.1 is the act of charting a course through what an operation is about to face. The five letters are Context, Hazards, Assess, Requirements and Translate, and they fall in the same order as the sub-clauses, from 6.1.1 through to 6.1.4.
How is CHART different from LDP?
CHART is a planning framework and LDP is a diagnostic one. CHART builds the action while it is still a decision, working forward from context to control. LDP tests whether the resulting system is lived, driven and proven once it is running. CHART is used before commitment; LDP is used after.
Does CHART only apply to risks, or to opportunities as well?
Both, and the opportunity side is where most organisations lose ground. Clause 6.1.2.3 requires opportunities to be assessed with the same rigour as risks, which is why Assess covers 6.1.2.2 and 6.1.2.3 together. In practice hazard registers fill up while opportunity registers stay empty.
Where does CHART most often fail in practice?
At Context and at Translate, the two ends. Planning that starts at Hazards inherits last year's assumptions about the operation, and planning that stops at a documented action produces something nobody carries. The middle three steps are the ones organisations tend to do well, which is why failures at either end are easy to miss.